This site has been discontinued. All new research will be posted at http://gersemiresearch.com. Free subscriptions available.
LPG-US: Initiation (Neutral, TP 6.9)
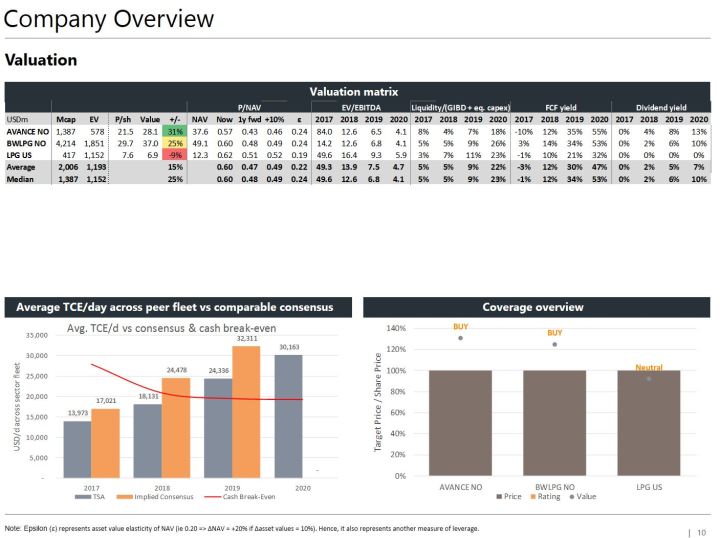
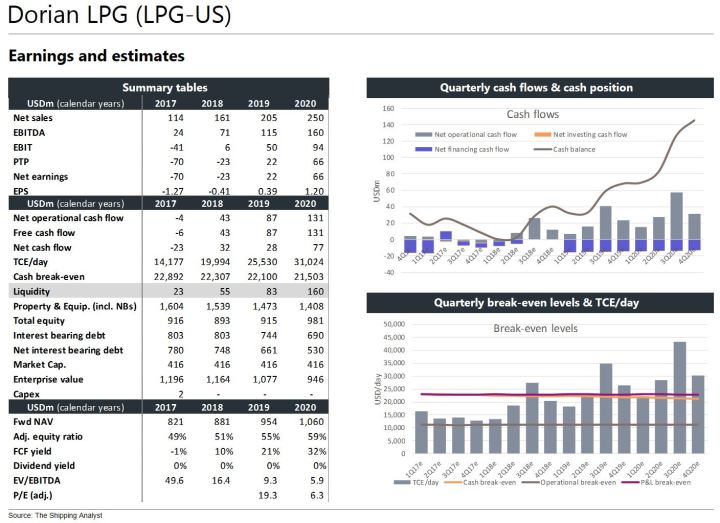
Dorian LPG has a fleet of 22 modern Very Large Gas Carriers (VLGC) with four on long time charters and the rest by large exposed to the current lackluster spot market. Recent corporate actions highlights the continued necessity of shoring up the balance sheet and ensuring liquidity as we await the cyclical upturn, which we pencil in from 2018E. Although we are positive on the sector outlook, we initiate coverage with a Neutral recommendation and a target price of USD 6.9 (-9%) due to the relatively high cash and P&L break-even levels. Dorian LPG is in our view priced ahead of peers Avance Gas (BUY, TP 28) and BW LPG (BUY, TP 37) in terms of both NAV and earning multiples.
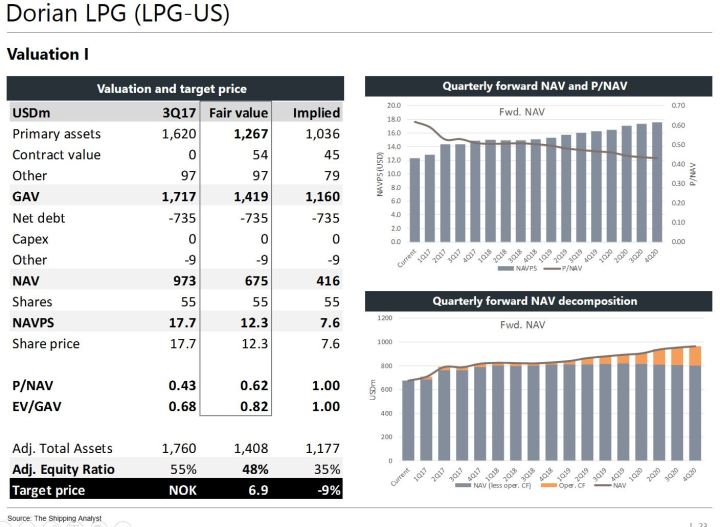
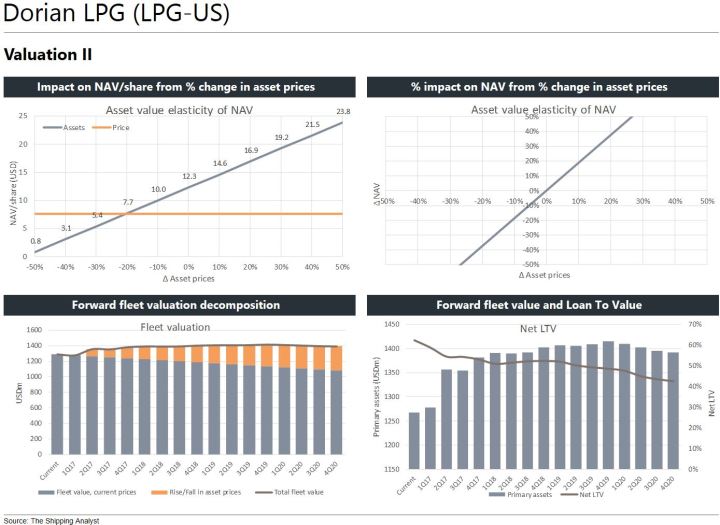
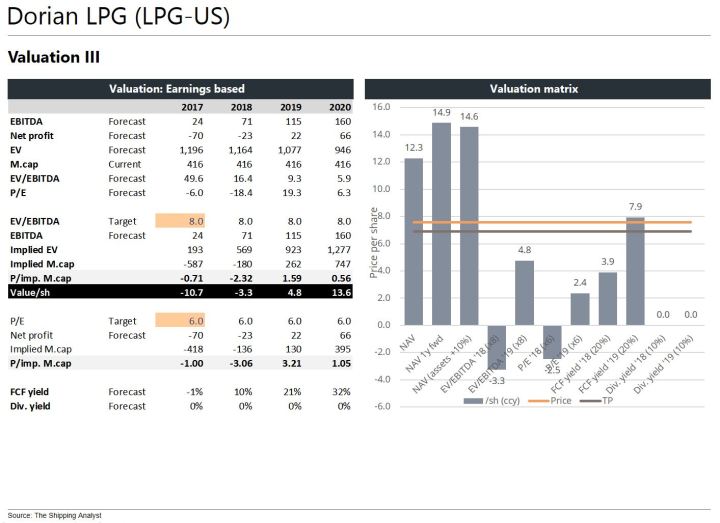
Valuation: We calculate a NAV of USD 12.3/sh (P/NAV 0.62), with one year forward NAV of USD 14.9/sh assuming asset prices rise ~10%. Our target price of USD 6.9/sh is based on a weighted average of current/future NAV and mid-cycle earnings multiples in 2018/19E.
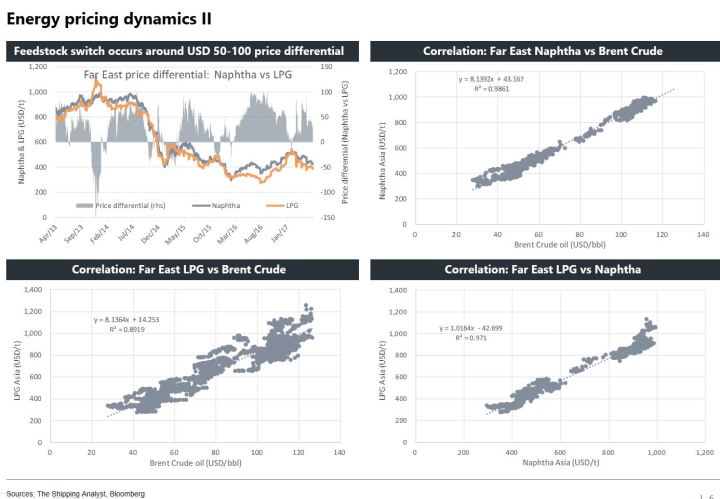
Market overview: Before the paradigm shift in 2014/15, LPG shipping on Very Large Gas Carriers (VLGC) had more industrial properties than today. The market was characterized by less spot activity, the Middle East as the main exporter and LPG prices primarily set to clear the market (supply driven). The US shale oil/gas boom, the collapse in oil prices and the massive expansion of US LPG export facilities have subsequently led to a market which is more spot cargo driven and dependent on the price differential between US and Asian energy prices being high enough for deep sea shipments of US LPG to make economically sense.
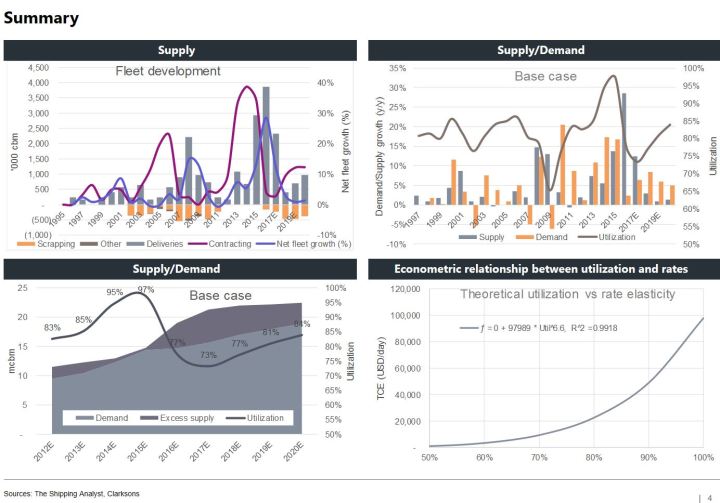
After enjoying super profits in 2014/15, VLGCs earnings collapsed under the weight of an extraordinary fleet growth from 164 vessels at the start of 2015 to 250 vessels today (CAGR of 19%), whereas demand has not kept up despite massive new US export capacity having de-bottlenecked the global trade. Lower global energy prices have also affected tonne-mile demand negatively, in concert with the expansion of the Panama Canal in mid-2016. Thus, we see two constraints that needs to be corrected before earnings once again can return to normalized levels and beyond: 1) The increase in global energy prices and 2) the reduction in the current tonnage oversupply.
The US rig count has risen 127% from the trough in mid-2016, representing increased present and future US shale oil and gas production. Hence, it is likely that excess LPG in the US will increase and prices will drop, increasing the LPG price differential vs the Far East, all else equal. However, the flip side of increased US production is lower global energy prices and thus lower LPG price differential. The optimal scenario would be high global energy prices and high shale production in the US, but this is not a base case scenario in our view. An increased LPG price differential is pivotal for making LPG shipments on VLGCs economical viable, with current theoretical TCE rates at USD -7k/d (vs USD 120k/d at the peak in mid-2014). Based on the current Brent crude oil futures curve, and assuming unchanged US LPG prices, we estimate VLGC rates below USD 10k/d until 2020E. However, elevating the futures curve by a mere USD 10/bbl to around USD 60/bbl enables theoretical VLGC rates around USD 40-50k/d. This shows how sensitive spot rates are to global energy prices. Overall, we forecast demand growth of 6% in 2017E, 8% in 2018E and 6% in 2019E (vs 6% average since 1999) based the new US export capacity coming online, a small increase in global energy prices and unchanged or falling US LPG prices.
In terms of supply growth, we are still seeing deliveries from the massive contracting during the 2014/15 super-cycle (current gross orderbook at 13% vs fleet). Given the lacklustre earnings and 17 vessels older than 30 years (6% of fleet), it would be natural to see significant scrapping at this point. However, we have only seen two vessels sent to the beaches over the past year, but we still believe scrapping to pick up going forward. Nevertheless, zero newbuildings have been contracted over the past year, thus laying the foundation for the next expansionary phase in the cycle. We forecast net supply growth of 12% in 2017E, 3% in 2018E and 1% in 2019E.
In sum, we expect utilization to trough at 73% in 2017E, recover to 77% in ’18E and rise to 81% in ‘19E. This equates to average VLGC spot rates of USD 13k/d in 2017E, USD 18k/d in ‘18E and USD 25k/d in ‘19E.
VLGC slide pack
Company specifics:
Market fundamentals:


Disclaimer: The publisher currently has no investments in the company
BWLPG-NO: Initiation (BUY, TP 37)
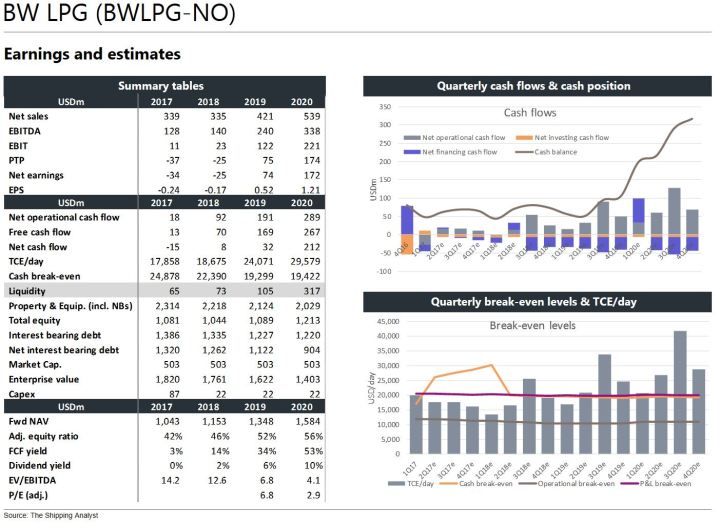
BW LPG controls a massive fleet of 51 Very Large Gas Carriers (VLGC) fully delivered in addition to four LGCs. The company has a history that exceeds most of its peers in addition to a differentiating industrial approach to LPG shipping, which is highly benefitial in the current depressed part of the cycle, but limits the upside in a boom. Having already swallowed recent entrant Aurora LPG, BW LPG remains key consolidator in an industry currently trading far below steel values. We initiate coverage with a BUY recommendation and NOK 37 target price (+23%) ahead of improving fundamentals.
Strategy: The company reported ~30% timecharter and Contract of Affreightment (COA) coverage for 2017 as of end 2016. This exemplifies the industrial approach to operations, which ensures utilization above peers through the cycle and mitigates the current trough spot earnings, but also limits the upside as we saw in the 2014/15 super-cycle. In terms of asset strategy, the company aims at the simplistic approach of investing low and divesting high, which it has successfully proven over time: Most recent examples are the acquisition of Aurora LPG and the August/16 divestment of the 2001-built BW Borg reported at USD 40.5m (vs our current generic value of 29m).
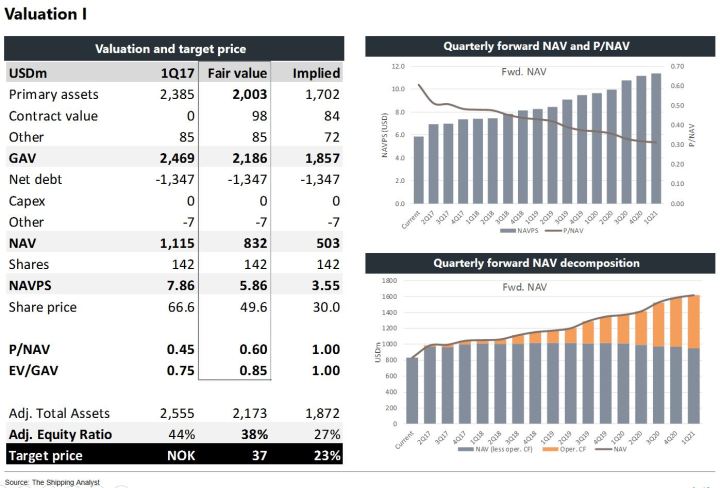
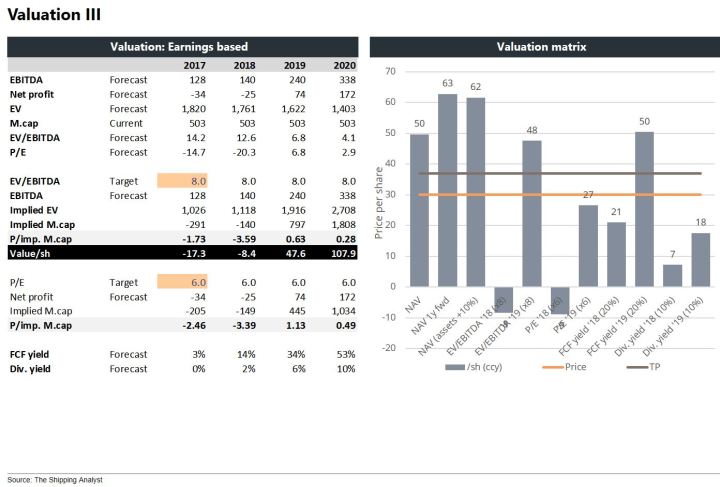
Valuation: We calculate a NAV of NOK 50/sh (P/NAV 0.6), with one year forward NAV of NOK 63/sh assuming asset prices rise ~10%. Our target price of NOK 37/sh is based on a weighted average of current/future NAV and mid-cycle multiples in 2018/19E.
Market overview: Before the paradigm shift in 2014/15, LPG shipping on Very Large Gas Carriers (VLGC) had more industrial properties than today. The market was characterized by less spot activity, the Middle East as the main exporter and LPG prices primarily set to clear the market (supply driven). The US shale oil/gas boom, the collapse in oil prices and the massive expansion of US LPG export facilities have subsequently led to a market which is more spot cargo driven and dependent on the price differential between US and Asian energy prices being high enough for deep sea shipments of US LPG to make economically sense.
After enjoying super profits in 2014/15, VLGCs earnings collapsed under the weight of an extraordinary fleet growth from 164 vessels at the start of 2015 to 250 vessels today (CAGR of 19%), whereas demand has not kept up despite massive new US export capacity having de-bottlenecked the global trade. Lower global energy prices have also affected tonne-mile demand negatively, in concert with the expansion of the Panama Canal in mid-2016. Thus, we see two constraints that needs to be corrected before earnings once again can return to normalized levels and beyond: 1) The increase in global energy prices and 2) the reduction in the current tonnage oversupply.
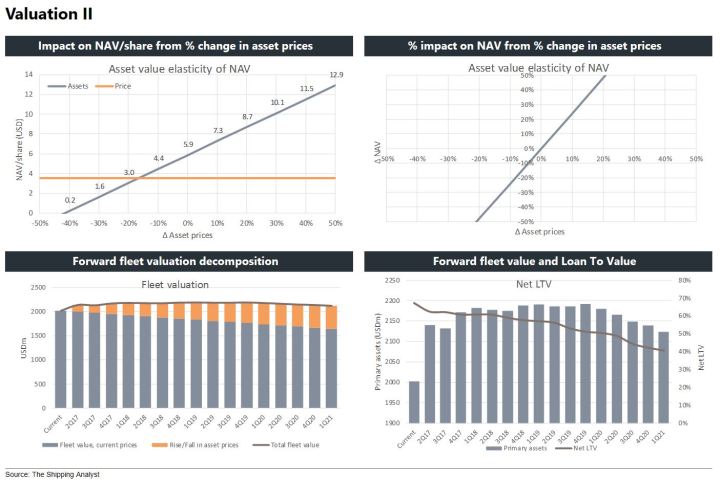
The US rig count has risen 127% from the trough in mid-2016, representing increased present and future US shale oil and gas production. Hence, it is likely that excess LPG in the US will increase and prices will drop, increasing the LPG price differential vs the Far East, all else equal. However, the flip side of increased US production is lower global energy prices and thus lower LPG price differential. The optimal scenario would be high global energy prices and high shale production in the US, but this is not a base case scenario in our view. An increased LPG price differential is pivotal for making LPG shipments on VLGCs economical viable, with current theoretical TCE rates at USD -7k/d (vs USD 120k/d at the peak in mid-2014). Based on the current Brent crude oil futures curve, and assuming unchanged US LPG prices, we estimate VLGC rates below USD 10k/d until 2020E. However, elevating the futures curve by a mere USD 10/bbl to around USD 60/bbl enables theoretical VLGC rates around USD 40-50k/d. This shows how sensitive spot rates are to global energy prices. Overall, we forecast demand growth of 6% in 2017E, 8% in 2018E and 6% in 2019E (vs 6% average since 1999) based the new US export capacity coming online, a small increase in global energy prices and unchanged or falling US LPG prices.
In terms of supply growth, we are still seeing deliveries from the massive contracting during the 2014/15 super-cycle (current gross orderbook at 13% vs fleet). Given the lacklustre earnings and 17 vessels older than 30 years (6% of fleet), it would be natural to see significant scrapping at this point. However, we have only seen two vessels sent to the beaches over the past year, but we still believe scrapping to pick up going forward. Nevertheless, zero newbuildings have been contracted over the past year, thus laying the foundation for the next expansionary phase in the cycle. We forecast net supply growth of 12% in 2017E, 3% in 2018E and 1% in 2019E.
In sum, we expect utilization to trough at 73% in 2017E, recover to 77% in ’18E and rise to 81% in ‘19E. This equates to average VLGC spot rates of USD 13k/d in 2017E, USD 18k/d in ‘18E and USD 25k/d in ‘19E.
Company specifics:
Market fundamentals:
Disclaimer: The publisher currently has no investments in the company
Dry Bulk: Sector Upgraded to BUY
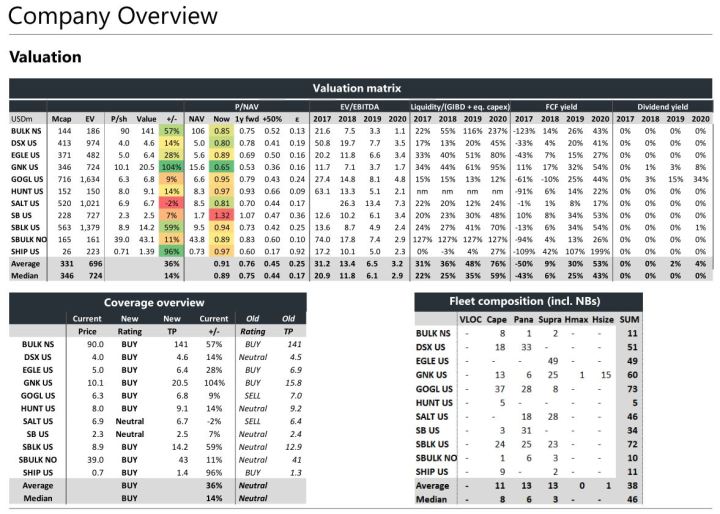
As we argued in our Dry Bulk: Sector Update in early April, share prices had moved too far too fast, disconnecting from the underlying fundamentals of the early expansionary phase of the cycle. We highlighted that the risk was skewed to the downside ahead of 2Q17E, and we issued three SELL recommendations and four Neutral. Since then, share prices have fallen some 30% before recovering somewhat in recent days, hitting or undershooting our target prices. Although share prices could fall even lower in the coming months, a period which is usually marked by a lull in activity ahead of an active Autumn market, we now find the risk/reward highly attractive. We upgrade the dry bulk sector to BUY (Neutral) and assign a BUY rating to nine of the 11 companies we cover.
Our top picks in the sector are:
- Genco Shipping (BUY, USD 21): 104% upside on last close
- Star Bulk (BUY, USD 14.2): 59% upside on last close
- Seanergy Maritime (BUY, USD 1.39): 96% upside on last close
A quick glance at fundamentals QTD indicates that net fleet growth for 2Q17E is approximately 0.6% q/q (vs our 1.2% forecast), versus an implied demand growth of 1.0% q/q (-1.1% forecast).
Please see our initiation reports for more information on each company we cover.
Disclaimer: The publisher currently owns shares in BULK-NS, EGLE-US, GNK-US, GOGL-NO, SHIP-US, SBLK-US
AVANCE-NO: Initiation (BUY, TP 28)
Avance Gas has a fleet of 14 Very Large Gas Carriers (VLGC) mainly constructed in China and South Korea. Despite the full spot rate exposure in an abysmal market, the company will retain a robust liquidity position on our estimates ahead of improving fundamentals. Trading at a 18% discount to steel values at the current trough, we see Avance as a prime target for M&A. We initiate coverage with a BUY recommendation and target price of USD 28/sh (+36%).
Valuation: We calculate a NAV of NOK 38/sh (P/NAV 0.55) after applying a USD 5m discount to the eight Chinese built VLGCs vs our generic South Korean based vessel values. Assuming asset prices rises 10% leads to a NAV of NOK 47/sh. Our target price of NOK 28/sh is based on a weighted average of current/future NAV and mid-cycle multiples in 2018/19E.
Market overview: Before the paradigm shift in 2014/15, LPG shipping on Very Large Gas Carriers (VLGC) had more industrial properties than today. The market was characterized by less spot activity, the Middle East as the main exporter and LPG prices primarily set to clear the market (supply driven). The US shale oil/gas boom, the collapse in oil prices and the massive expansion of US LPG export facilities have subsequently led to a market which is more spot cargo driven and dependent on the price differential between US and Asian energy prices being high enough for deep sea shipments of US LPG to make economically sense.
After enjoying super profits in 2014/15, VLGCs earnings collapsed under the weight of an extraordinary fleet growth from 164 vessels at the start of 2015 to 250 vessels today (CAGR of 19%), whereas demand has not kept up despite massive new US export capacity having de-bottlenecked the global trade. Lower global energy prices have also affected tonne-mile demand negatively, in concert with the expansion of the Panama Canal in mid-2016. Thus, we see two constraints that needs to be corrected before earnings once again can return to normalized levels and beyond: 1) The increase in global energy prices and 2) the reduction in the current tonnage oversupply.
The US rig count has risen 127% from the trough in mid-2016, representing increased present and future US shale oil and gas production. Hence, it is likely that excess LPG in the US will increase and prices will drop, increasing the LPG price differential vs the Far East, all else equal. However, the flip side of increased US production is lower global energy prices and thus lower LPG price differential. The optimal scenario would be high global energy prices and high shale production in the US, but this is not a base case scenario in our view. An increased LPG price differential is pivotal for making LPG shipments on VLGCs economical viable, with current theoretical TCE rates at USD -7k/d (vs USD 120k/d at the peak in mid-2014). Based on the current Brent crude oil futures curve, and assuming unchanged US LPG prices, we estimate VLGC rates below USD 10k/d until 2020E. However, elevating the futures curve by a mere USD 10/bbl to around USD 60/bbl enables theoretical VLGC rates around USD 40-50k/d. This shows how sensitive spot rates are to global energy prices. Overall, we forecast demand growth of 6% in 2017E, 8% in 2018E and 6% in 2019E (vs 6% average since 1999) based the new US export capacity coming online, a small increase in global energy prices and unchanged or falling US LPG prices.
In terms of supply growth, we are still seeing deliveries from the massive contracting during the 2014/15 super-cycle (current gross orderbook at 13% vs fleet). Given the lacklustre earnings and 17 vessels older than 30 years (6% of fleet), it would be natural to see significant scrapping at this point. However, we have only seen two vessels sent to the beaches over the past year, but we still believe scrapping to pick up going forward. Nevertheless, zero newbuildings have been contracted over the past year, thus laying the foundation for the next expansionary phase in the cycle. We forecast net supply growth of 12% in 2017E, 3% in 2018E and 1% in 2019E.
In sum, we expect utilization to trough at 73% in 2017E, recover to 77% in ’18E and rise to 81% in ‘19E. This equates to average VLGC spot rates of USD 13k/d in 2017E, USD 18k/d in ‘18E and USD 25k/d in ‘19E.
Company specifics:


Market fundamentals:
Disclaimer: The publisher currently has no investments in the company
Tanker consolidation continues with TNK acquiring TIL
Teekay Tankers today announced the acquisition of Tanker Investments in an all-share deal which values TIL at a 21% premium to last close and which reflects a NAV-for-NAV transaction on our estimates. TIL’s shareholder will end up with 38% of NewCo vs a NAV contribution of ~39% and TNK’s shareholder with the remaining 62% with a NAV contribution of ~61%. We view the transaction as positive for both companies as TIL releases some of the massive discount to NAV which has been inherent in the share price since inception in 2014, and TNK which strengthens the balance sheet and alleviates some of our concerns around the liquidity situation through the trough. The two companies also forms a natural fit as TNK owns 11.3% of TIL and already provides technical and commercial management of TIL’s fleet. We reiterate our SELL recommendation on TNK but raise our target price to USD 1.2/sh (USD 1.1) to reflect the decreased liquidity challenge.
Deal highlights:
- “Each TIL common share will receive 3.30 Teekay Tankers Class A common shares
representing a 21% premium to TIL’s closing share price on May 31, 2017, and a 29% premium based on TNK’s 30-day volume weighted average price (VWAP)” - “Creates the world’s largest publicly-traded mid-sized conventional tanker company
with combined total assets of $2.4 billion” - “Upon completion of the merger, Tanker Investments’ shareholders (other than Teekay Tankers and Teekay Corporation) will own approximately 30% of the combined entity, consisting of 62 conventional tankers, including three in-chartered vessels (30 Suezmax tankers, 22 Aframax tankers, 9 LR2 Product tankers and one 50 percent-owned VLCC tanker).”
http://tankerinvestments.com/wp-content/uploads/2017/05/TIL-agrees-to-merge-with-TNK.pdf
DISCLAIMER: THE PUBLISHER CURRENTLY HAS NO INVESTMENTS IN THE COMPANY
ESV acquires ATW to create an undervalued rig behemoth
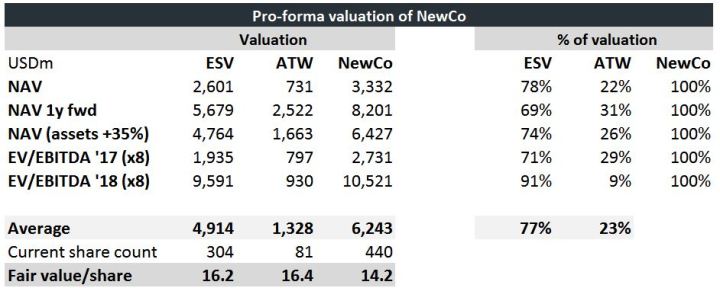
In line with our expectations expressed in our initiation of Ensco (BUY, TP 17), the company takes on the role as consolidator in the current trough. Today, ESV announced the acquisition of Atwood Oceanics (BUY, TP 19) in an all-share deal that values ATW at a 33% premium to last close and leaves ATW shareholders with around 31% of the NewCo. Although we believe the offer to be a bit fresh at an EV/EBITDA ‘17E of 8.3x (vs peers at 7.0x), P/NAV of 1.18 and EV/GAV of 1.05, we see a good fit between the fleets and organizational synergies. Overall, we believe the offer is most beneficial for Atwood’s shareholders, but also expect valuation release for Ensco shareholders as the USD 10.72/sh acquisition price is far below our USD 19/sh pre-deal target price for Atwood. We estimate a pro-forma fair value USD 14.2/sh and reiterate our BUY recommendation.
Sector read-across: After Borr Drilling’s latest acquisition of Transocean’s fleet of jackups and some other smaller transactions, we definitely see the increased M&A and S&P activity as positive and a confirmation that key market participants share our view that a recovery is closing in. Recent data also points to an increased demand for rigs, lending further support to our positive view on future rig fundamentals.
Deal highlights:
- “Atwood shareholders will receive 1.60 shares of Ensco for each share of Atwood common stock for a total value of $10.72 per Atwood share based on Ensco’s closing share price of $6.70 on 26 May 2017. This represents a premium of approximately 33% to Atwood’s closing price on the same date”
- “Ensco and Atwood shareholders will own approximately 69% and 31%, respectively, of the outstanding shares of Ensco”
- “There are no financing conditions for this transaction”
- “Ensco expects to realize annual pre-tax expense synergies of approximately $65 million for full year 2019 and beyond. The combination is expected to be accretive on a discounted cash flow basis”
- “The balance sheet of the combined company will remain strong. Adjusted for the expected retirement of Atwood’s outstanding revolving credit facility with cash and short-term investments on hand, total available liquidity was $3.9 billion on 31 March 2017 and included $1.6 billion of cash and short-term investments”
- “The combined company will have a fleet of 63 rigs, comprised of ultra-deepwater drillships, versatile deep- and mid-water semisubmersibles and shallow-water jackups, along with a diverse customer base of 27 national oil companies, supermajors and independents.”
http://ir.atwd.com/file/Index?KeyFile=2000800211
Disclaimer: The publisher currently owns shares in Ensco
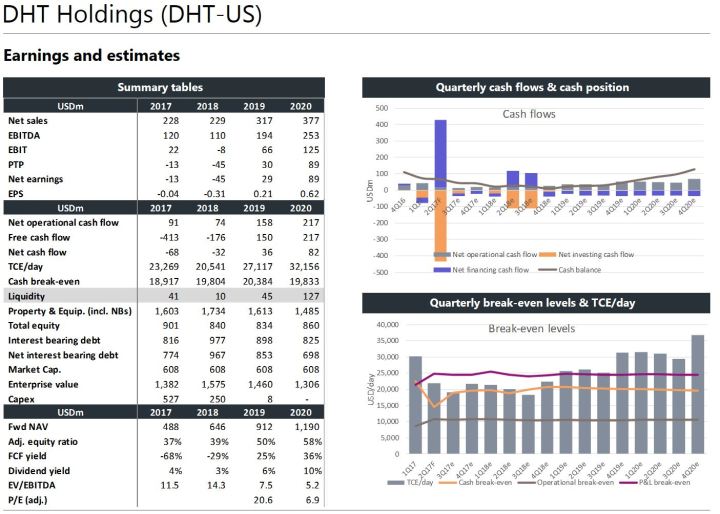
DHT-US: Initiation (SELL, TP 4.0)
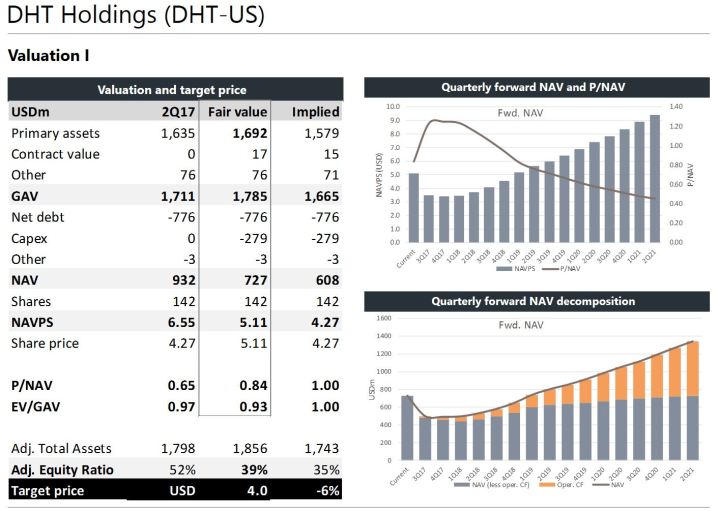
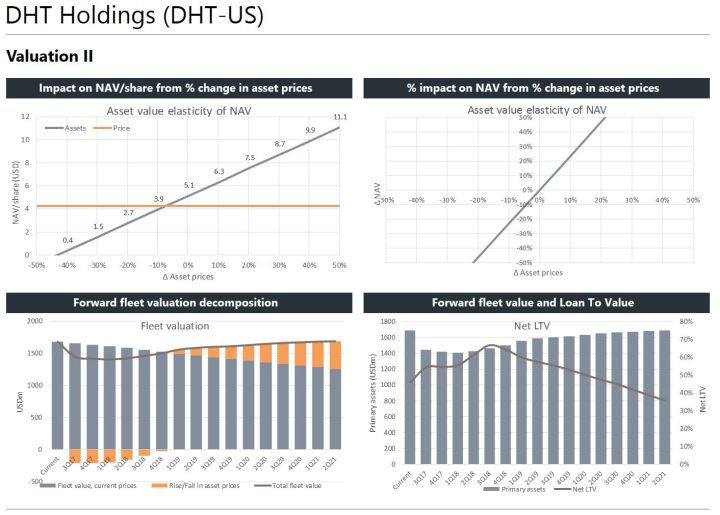
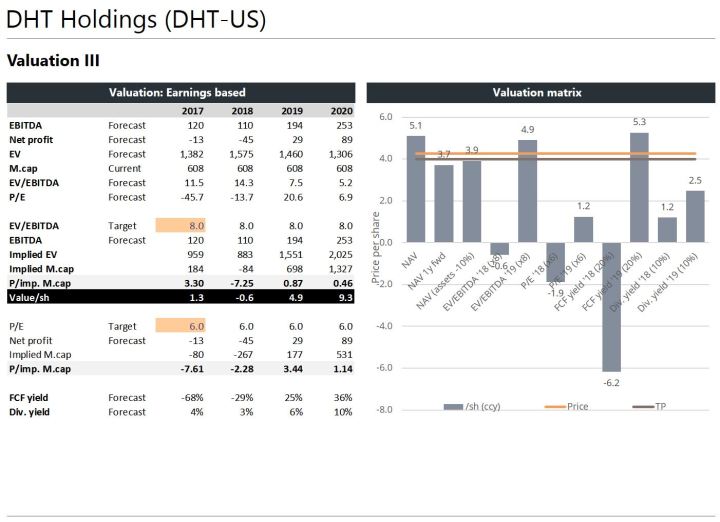
After an aggressive M&A attempt by Frontline that by some accounts is still ongoing but from a financial standpoint appears dead, the company acquired BW’s fleet of VLCCs through a combination of new shares and cash, and has emerged as one of the largest listed crude tanker companies with 30 VLCCs and 2 Aframaxes on a fully delivered basis. Although we expect the company to continue scaling down its dividends, we believe DHT has enough cash to maintain a yield of some 3-4% through the trough given its low cash break-even vs peers and recently secured USD 383m in new debt. If our earnings base case were to undershoot significantly, the company can further ease the strain on cash through the abolition of dividends and/or increasing leverage on its balance sheet (net LTV peak at 67% in 3q18E). Despite being our top-pick in the crude tanker sector, we initiate coverage of DHT with a SELL recommendation and target price of USD 4.0 (-6%) given the lackluster short-term outlook for the sector.
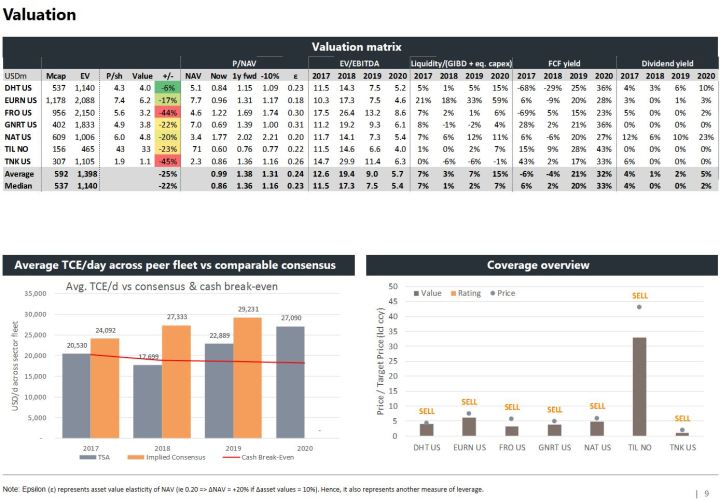
Valuation: We calculate a current NAV of USD 5,1/sh (P/NAV = 0.84, peers at 0.86), but see downside due to continued falling asset prices, aging of the fleet and limited cash flow generation. Our target price of USD 4.0/sh is based on a weighted average of current/future NAV and mid-cycle multiples in 2019E.
For more information on the M&A proposal from Frontline, the on-going debacle and subsequent M&A with BW, please see press releases from DHT and Frontline.
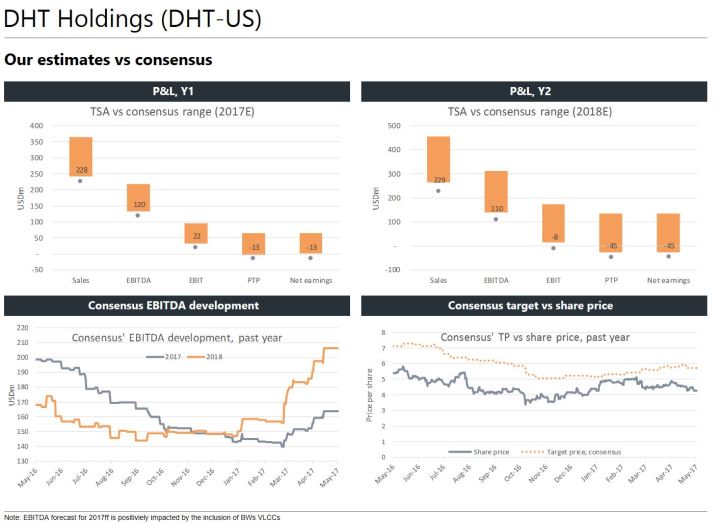
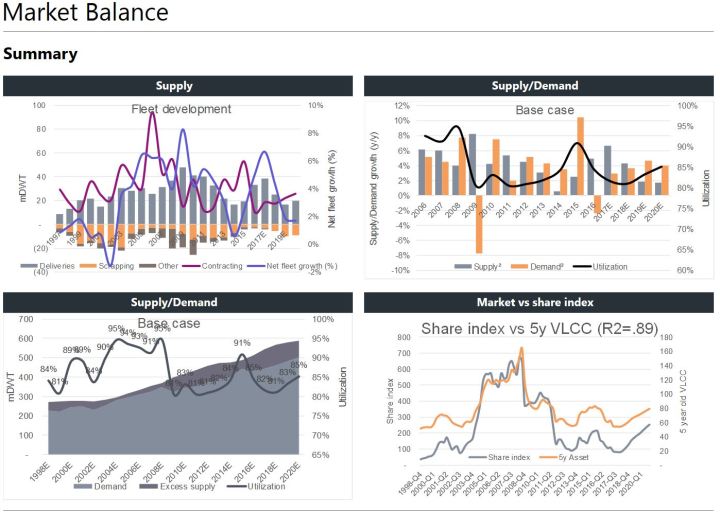
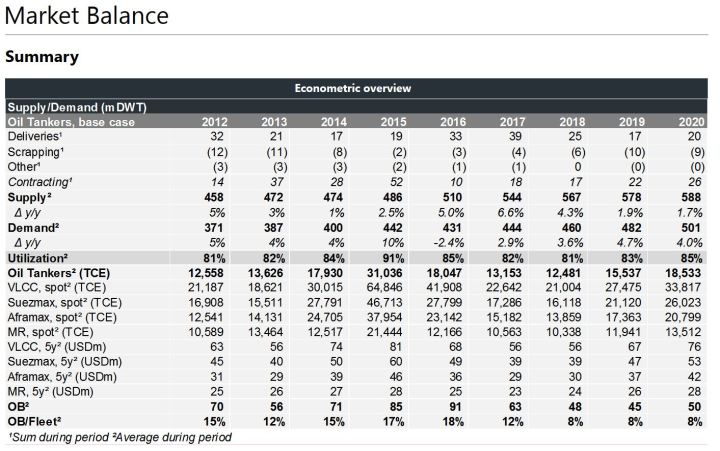
Market overview: After enjoying a brief peak in 2015, oil tanker earnings were soon subdued again as overly eager owners contracted too many ships in the cyclical expansion, resulting in a rapidly increasing net fleet growth from 1Q16. The elevated supply growth persists, with a net fleet growth of 2.0% in 1Q17 alone. We forecast net fleet growth of 7% in 2017E, 4% in ‘18E and 2% in ‘19E. Although supply growth in 2019E implies a pivotal point in the cycle, recent increase in contracting (annualized YTD 5% of the fleet, 336% above same period 2016) could hamper a potential recovery in 2019.
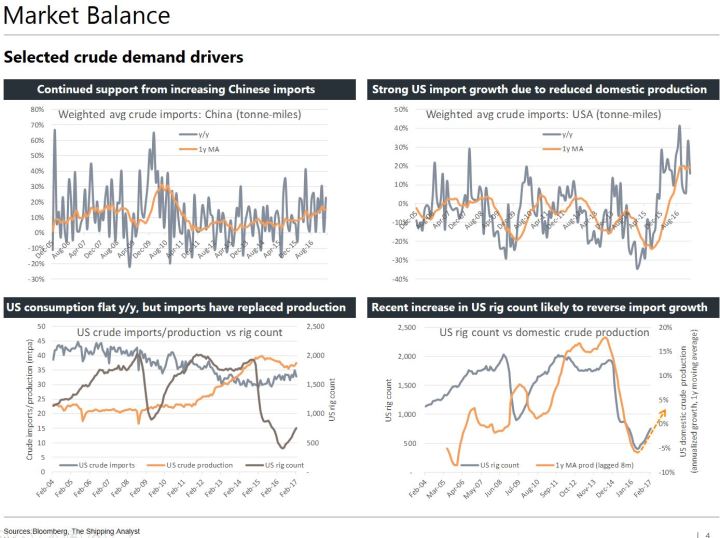
We forecast a low but steady demand growth of 3% in 2017E, 4% in ‘18E and 5% in ‘19E. Although implied demand growth in 2016E was negative, US crude oil imports on a tonne-mile basis increased some 18% and has continued the trend YTD. However, we expect the tonne-mile growth to abate or even reverse going forward as consumption growth is muted while recent increase in the rig count will likely increase domestic production (see graphs below). Looking to China, crude oil imports on a tonne-mile basis increased around 14% in 2016E, but we expect the growth to subside somewhat as leading indicators point to a cooling of the Chinese economy.
In sum, we expect utilization to fall 3%p to 82% in 2017E, down another 1%p in ‘18E before the recovery starts in ‘19E with utilization rising 2%p to 83%. Given the forward-looking nature of share and asset prices, and the historical significant relationship between the two;  we forecast 3Q17E-2Q18E to represent the share price trough. More specifically, we expect that increasing earnings will lead to rising asset and share prices from 2H18E, and believe just prior or just after the next winter season (circa Oct’17-Feb’18) to be an opportune moment to BUY, all else equal.
Company specifics:
Peer overview:
Market fundamentals:
Disclaimer: The publisher currently has no investments in the company
TNK-US: Initiation (SELL, TP 1.1)
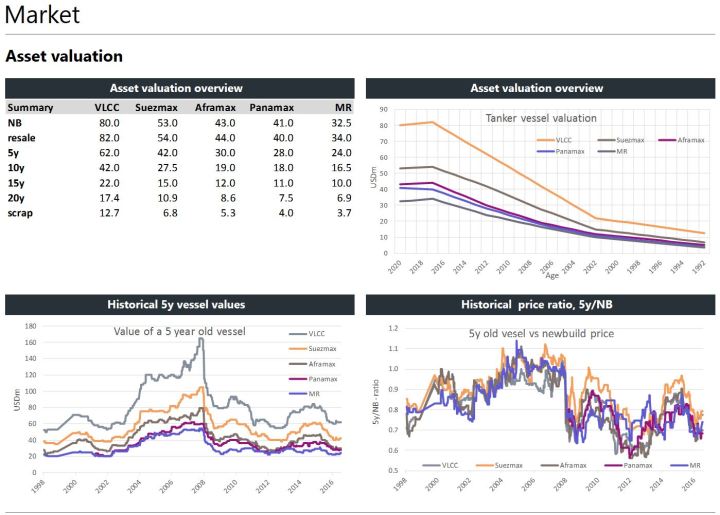
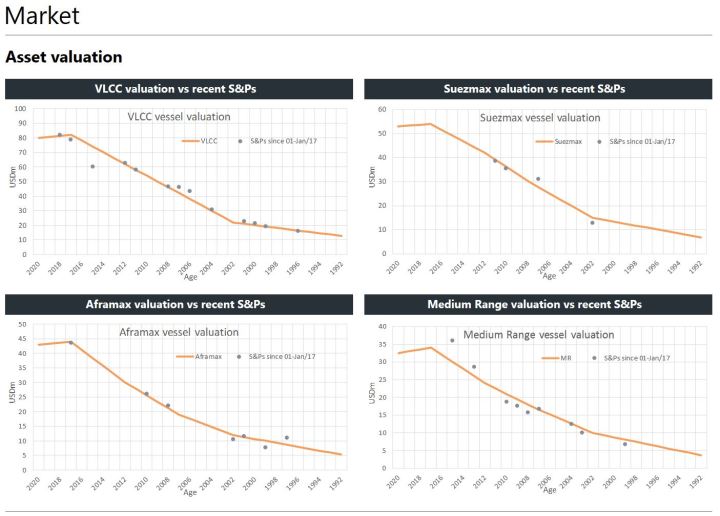
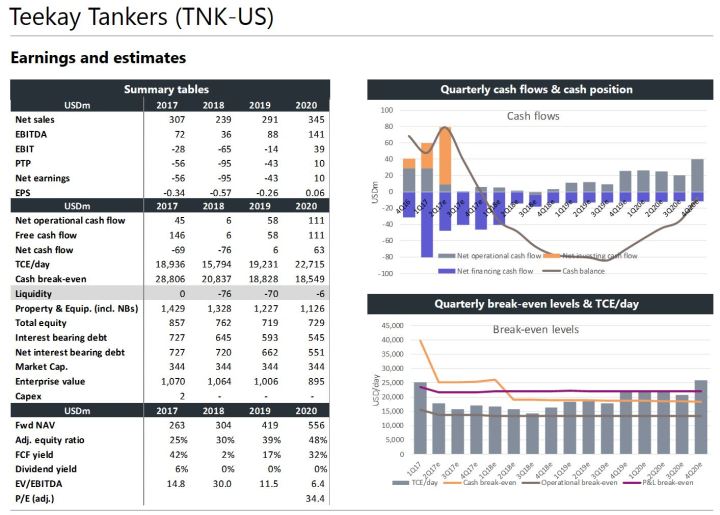
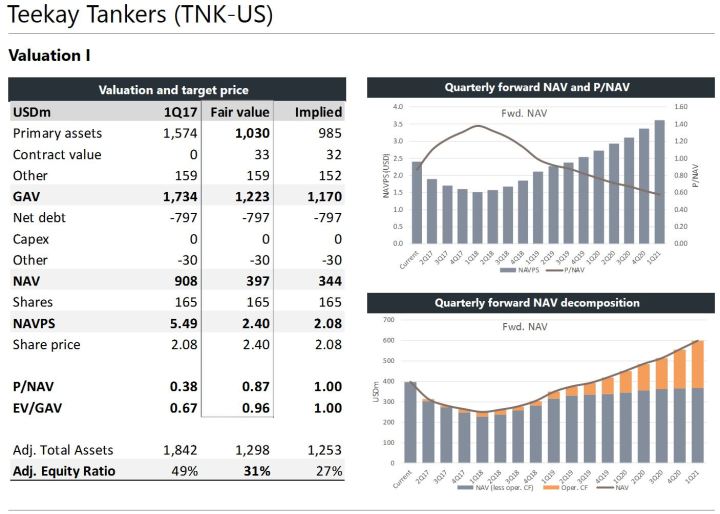
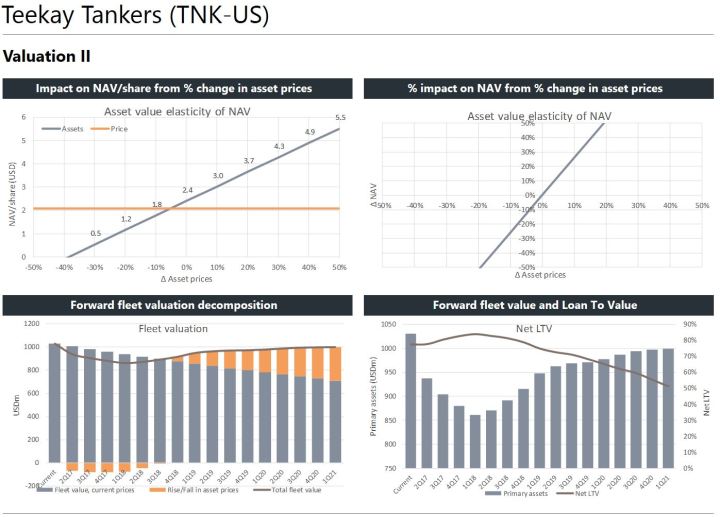
Teekay Tankers has a fleet of 41 fully owned Suezmaxes and Aframax/LR2s, a 50/50 owned VLCC in addition to a handful of chartered in vessels. Despite the recently announced divestment of a 1999-built Aframax at USD 7.5m (vs our generic value at USD 9.7m) and the sale/lease-back of four modern Suezmaxes, we see a significant liquidity challenge through the trough. Assuming an abolition of dividends (5.8% yield annualized on last close) and given the Net-Loan-To-Value of ~77%, we expect further fleet divestment to have limited impact. Given our forecast of continued sliding asset prices, we look to a debt moratorium or further sale/lease-backs for a sustainable solution to take the company through the trough without diluting existing shareholders. We initiate coverage with a SELL recommendation and target price of USD 1.1/sh (-49%).
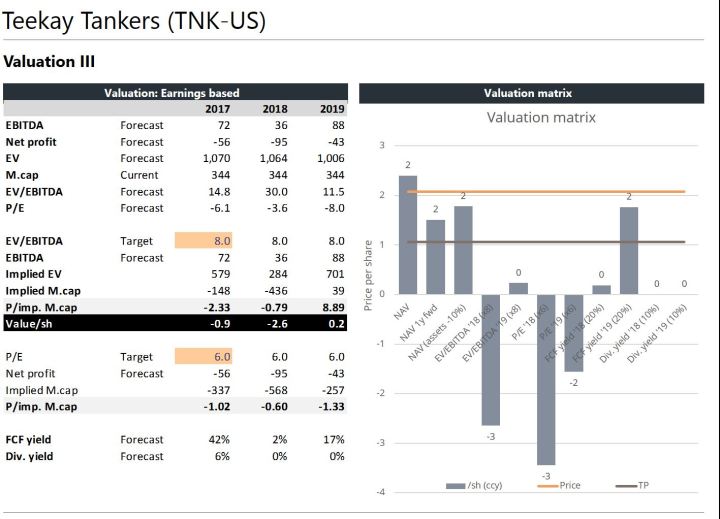
Valuation: We calculate a current NAV of USD 2.4/sh, but see downside due to continued falling asset prices, aging fleet and limited cash flow generation. Our target price of USD 1.1/sh is based on a weighted average of current/future NAV and mid-cycle multiples in 2019E.
Market overview: After enjoying a brief peak in 2015, oil tanker earnings were soon subdued again as overly eager owners contracted too many ships in the cyclical expansion, resulting in a rapidly increasing net fleet growth from 1Q16. The elevated supply growth persists, with a net fleet growth of 2.0% in 1Q17 alone. We forecast net fleet growth of 7% in 2017E, 4% in ‘18E and 2% in ‘19E. Although supply growth in 2019E implies a pivotal point in the cycle, recent increase in contracting (annualized YTD 5% of the fleet, 336% above same period 2016) could hamper a potential recovery in 2019.
We forecast a low but steady demand growth of 3% in 2017E, 4% in ‘18E and 5% in ‘19E. Although implied demand growth in 2016E was negative, US crude oil imports on a tonne-mile basis increased some 18% and has continued the trend YTD. However, we expect the tonne-mile growth to abate or even reverse going forward as consumption growth is muted while recent increase in the rig count will likely increase domestic production (see graphs below). Looking to China, crude oil imports on a tonne-mile basis increased around 14% in 2016E, but we expect the growth to subside somewhat as leading indicators point to a cooling of the Chinese economy.
In sum, we expect utilization to fall 3%p to 82% in 2017E, down another 1%p in ‘18E before the recovery starts in ‘19E with utilization rising 2%p to 83%. Given the forward-looking nature of share and asset prices, and the historical significant relationship between the two; we forecast 3Q17E-2Q18E to represent the share price trough. More specifically, we expect that increasing earnings will lead to rising asset and share prices from 2H18E, and believe just prior or just after the next winter season (circa Oct’17-Feb’18) to be an opportune moment to BUY, all else equal.
Company specifics:
Market fundamentals:
Disclaimer: The publisher currently has no investments in the company
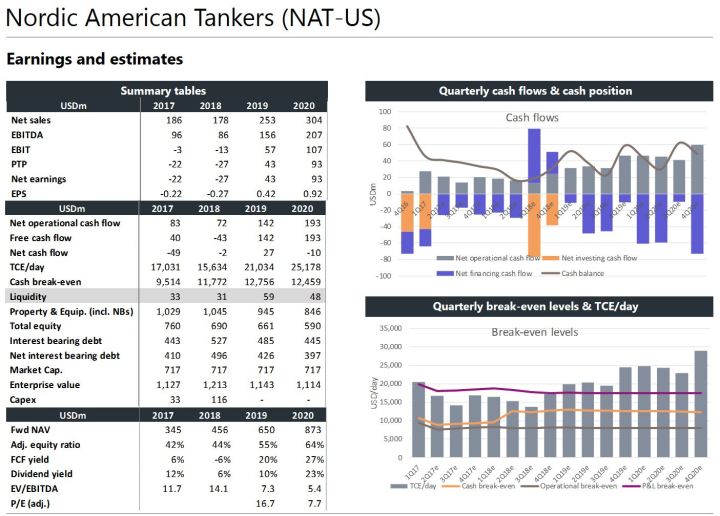
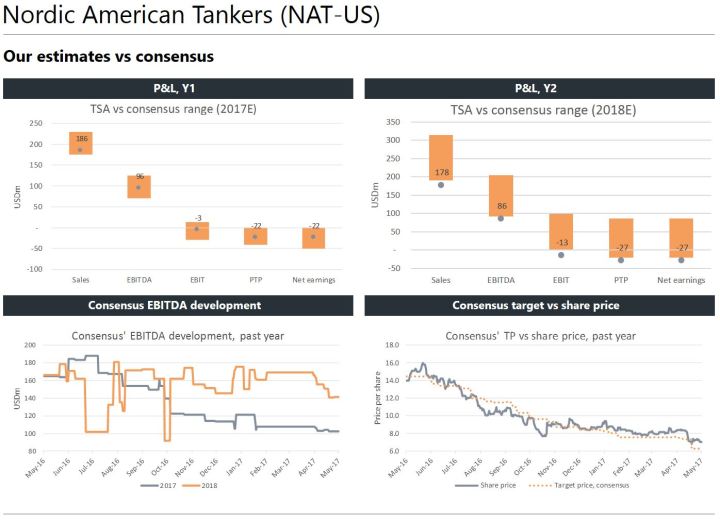
NAT-US: Initiation (SELL, TP 4.8)
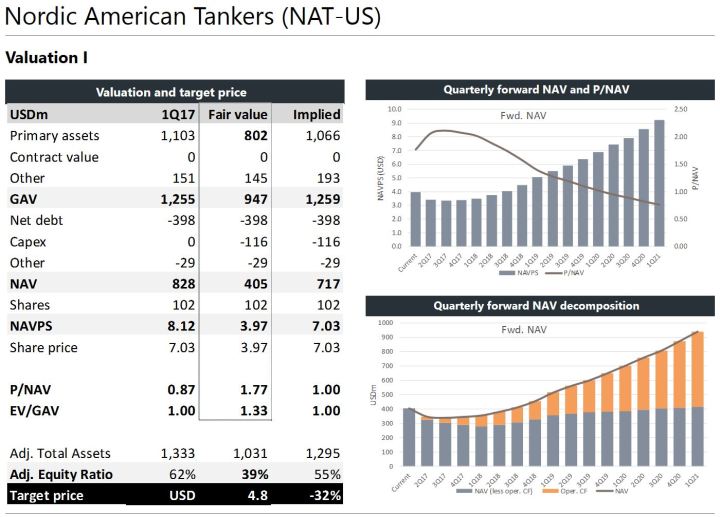
Nordic American Tankers has a fleet of 33 Suezmaxes (incl. three newbuldings) and a 23% ownership in Nordic American Offshore worth USD 15m (USD 0.15/sh). The company is currently priced at a P/NAV of 1.8 (peer avg of 0.9) and a dividend yield of 11% (peer avg 2%), which we see as challenging amidst continued falling asset prices and earnings as the cyclical trough develops. We initiate coverage with a SELL recommendation and target price of USD 4.8/sh (-32%).
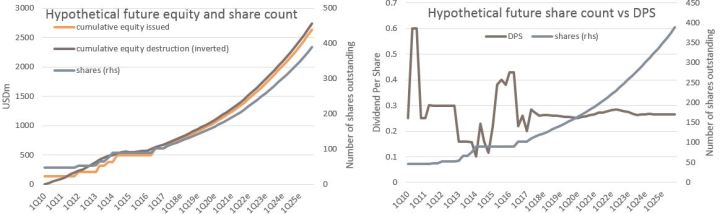
In our view, the financial strategy and market pricing of NAT is rare and intriguing in the world of commodity shipping. The company has paid dividends for 79 consecutive quarters, and have achieved an impressive dividend pricing usually only found amongst Master Limited Partnerships (MLPs). The company has on average paid USD 23m above net profit in dividends since 1Q10, leading to a cumulative equity deficit of USD -674m as of 1Q17. In the same period, NAT has issued USD 618m in new equity, taking the share count from 47m to 102m. In order to maintain a steady dividend per share and a fleet of similar earnings capacity, the company will have to continue issuing an exponential number shares through the cycles. If the premium pricing to NAV was to diminish, the share growth needed to maintain the dividend would have to increase, making the exponential function even steeper.
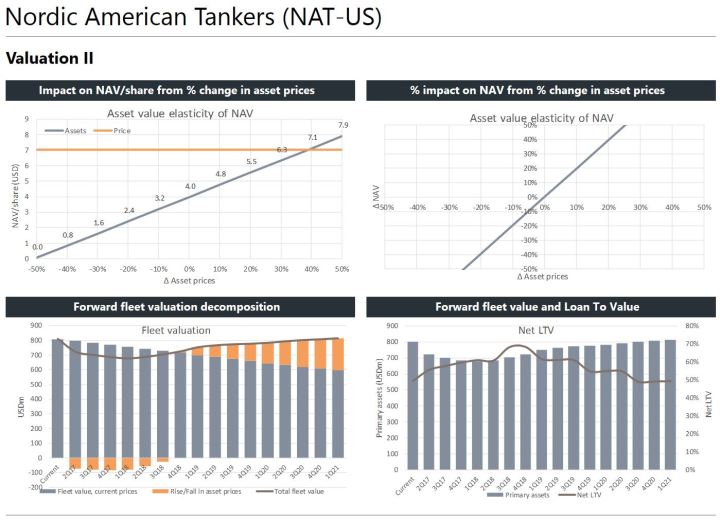
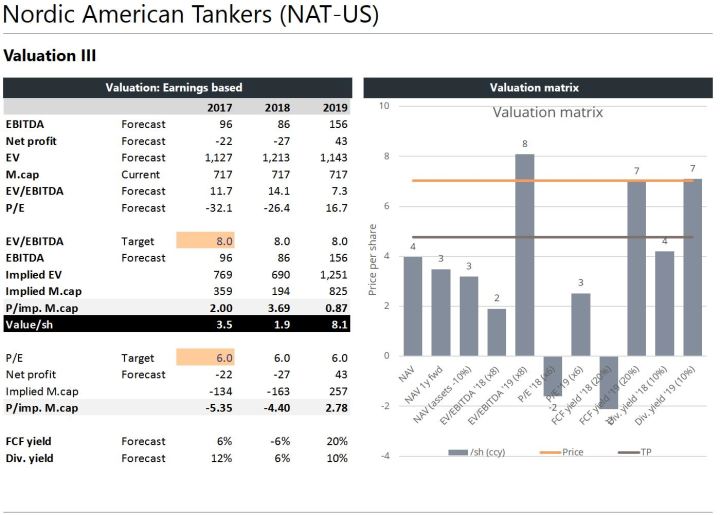
Valuation: We calculate a current NAV of USD 4.0/sh, but see downside due to continued falling asset prices. Our target price of USD 4.8/sh is based on a weighted average of current/future NAV and mid-cycle multiples in 2019E with the added value of a high dividend yield.
Market overview: After enjoying a brief peak in 2015, oil tanker earnings were soon subdued again as overly eager owners contracted too many ships in the cyclical expansion, resulting in a rapidly increasing net fleet growth from 1Q16. The elevated supply growth persists, with a net fleet growth of 2.0% in 1Q17 alone. We forecast net fleet growth of 7% in 2017E, 4% in ‘18E and 2% in ‘19E. Although supply growth in 2019E implies a pivotal point in the cycle, recent increase in contracting (annualized YTD 5% of the fleet, 336% above same period 2016) could hamper a potential recovery in 2019.
We forecast a low but steady demand growth of 3% in 2017E, 4% in ‘18E and 5% in ‘19E. Although implied demand growth in 2016E was negative, US crude oil imports on a tonne-mile basis increased some 18% and has continued the trend YTD. However, we expect the tonne-mile growth to abate or even reverse going forward as consumption growth is muted while recent increase in the rig count will likely increase domestic production (see graphs below). Looking to China, crude oil imports on a tonne-mile basis increased around 14% in 2016E, but we expect the growth to subside somewhat as leading indicators point to a cooling of the Chinese economy.
In sum, we expect utilization to fall 3%p to 82% in 2017E, down another 1%p in ‘18E before the recovery starts in ‘19E with utilization rising 2%p to 83%. Given the forward-looking nature of share and asset prices, and the historical significant relationship between the two; we forecast 3Q17E-2Q18E to represent the share price trough. More specifically, we expect that increasing earnings will lead to rising asset and share prices from 2H18E, and believe just prior or just after the next winter season (circa Oct’17-Feb’18) to be an opportune moment to BUY, all else equal.
Company specifics:
Market fundamentals:
